Trinnov was founded to do fundamental research into three-dimensional sound. Even the name “Trinnov Audio” derives from “Tri” (the prefix for “3”) and “Innovation” – hence, Innovation in 3D Sound.
One of the earliest discoveries was that re-creating a coherent, convincing three-dimensional soundfield was impossible unless you could get all the speakers and the room itself to behave in a fairly ideal fashion. Even small differences in either the frequency or the time domains destroyed the illusion. It turns out that humans are really quite good at discerning The Real Thing (apologies to a certain soft drink manufacturer).
This realization led directly to the development of the Speaker/Room Optimizer: a system that provides extremely high-resolution measurements in both the frequency and the time domains and accurately derives the necessary corrections required for all parts of the system to work together to create a convincing, complex, 3D soundfield.
But, for non-scientists, what does the Optimizer actually do?
This article will attempt to explain one specific part of what the optimizer does: high-resolution impulse response measurements. Or, if you prefer, measuring the degree to which the system is doing the right thing, at the right time. Both are essential.
First, a brief, important, and admittedly geeky detour: most people reading this newsletter will know what a square wave looks like. But did you know that you can create a square wave with nothing other than an infinitely-long series of nice, smooth sine waves? It works the other way around, too: a square wave can be represented as an infinitely-long series of pure sine waves. As an example, a 1 Hz square wave is comprised of a long series of the fundamental plus all of the odd harmonics (1 Hz, 3 Hz, 5 Hz, 7 Hz, etc.).
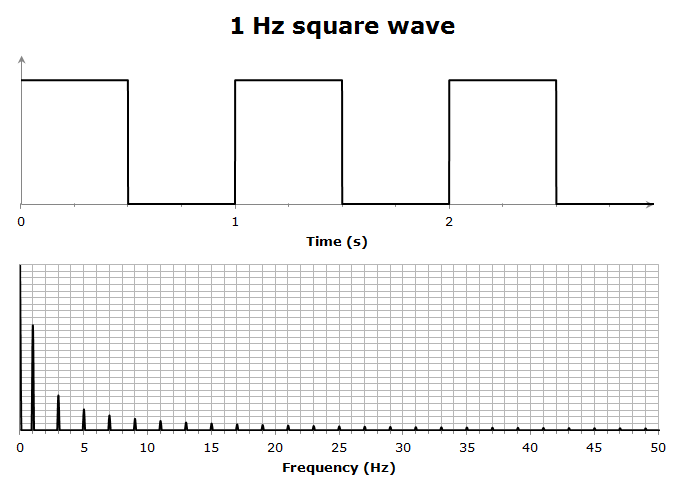
If you show a square wave on an oscilloscope it looks, well, square; if you look at the energy spectrum of the same square wave, you will see diminishing bursts of energy at all of those odd frequencies (1, 3, 5, 7, etc).
The important take-away is that these are simply two ways of seeing the exact same thing. They may appear to be different, but they are not. (For more information, Google Fourier Analysis of Square Waves. Note that this is just one specific example of a much more general mathematical truth.)
In digital signal processing, this ability to move back and forth between the frequency domain (“how large are the various frequencies?”) and the time domain (“how long does each square of the wave last?”) allows us to learn a great deal about both domains, quite efficiently.
Compared to traditional Real-Time Analysis with Pink Noise… well, there is no comparison.
RTA provides no information about whether things are happening when they should – only that they happened somewhere along the way. This is like sitting in the audience of a symphony orchestra, only to find that each musician is walking out on stage, playing their part, and then being replaced by the next musician who does the same. It is not particularly satisfying.
Having rich, detailed information about what happened and when it happened is the essential first step to being able to determine the true nature of any possible problems and what the best solutions might be.
Enough theory. Why are you talking about this?
Well, let’s look at a practical example.
Imagine a recording of a pistol being fired out in a wide-open space. The microphone’s diaphragm would be pushed very quickly in one direction by the crack of the sound wave. If it is a good microphone, the diaphragm would settle down almost immediately as the sound passed by and kept going. In music, perhaps the recording is of a rim shot on a snare drum. You get the idea.
An idealized test signal along these lines would look like the red line, below. If you were to think of the perfect speaker’s response to this input, all the drivers would move forward at the same time and then return to their resting position immediately, without any overshoot or timing errors. (You see? Time-domain information.)
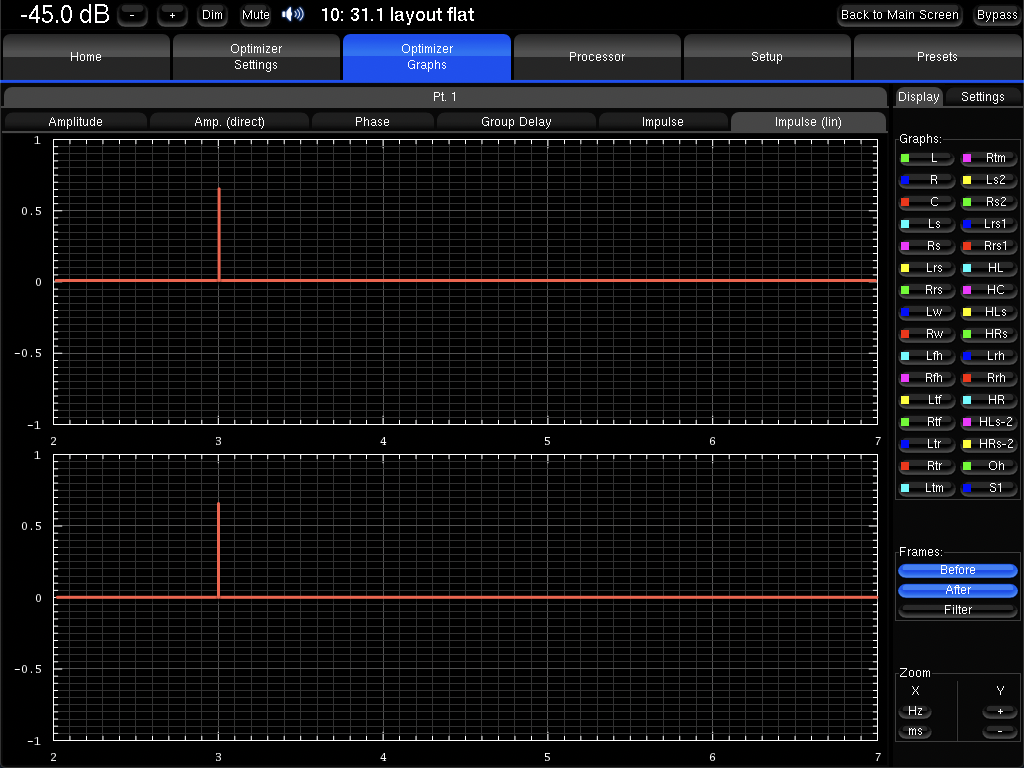
So, let’s see what might actually happen. In the real world, drivers have mass and their suspensions are like springs. Even really good ones must still obey the laws of physics.
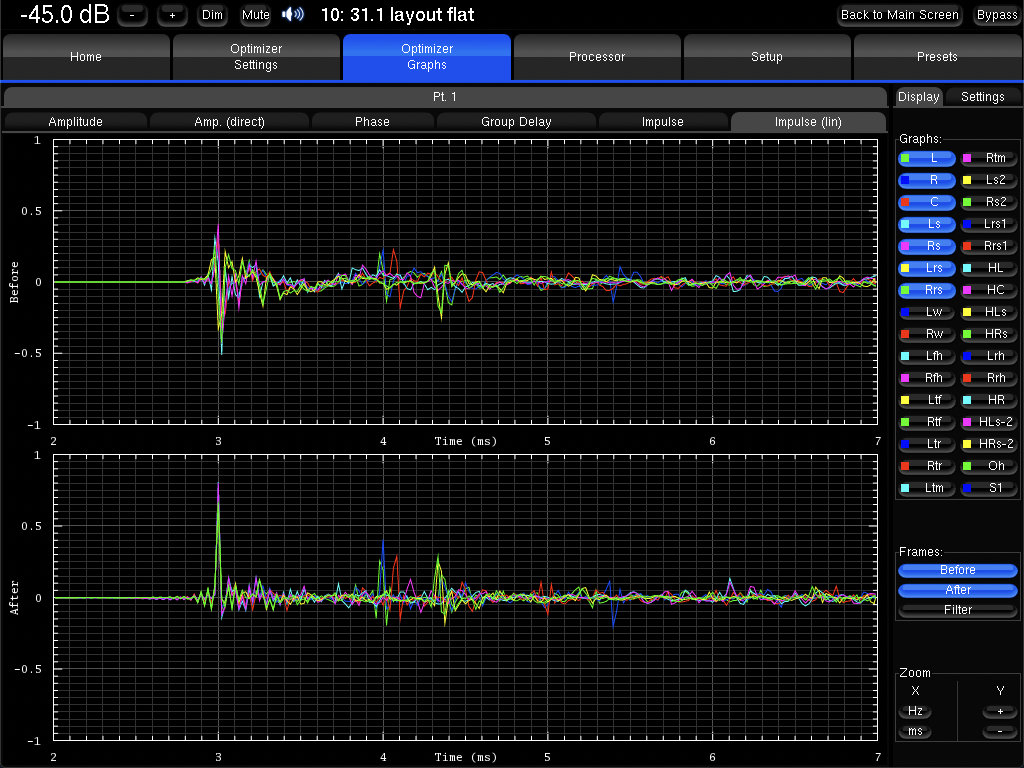
Looking at just the Left and Right speakers in this system, looking around 3ms, we see in the Before correction measurement that they start out in the right direction, under-react a bit, and then overshoot a bit before they settle down. These are quite good speakers, so they settle down quickly.
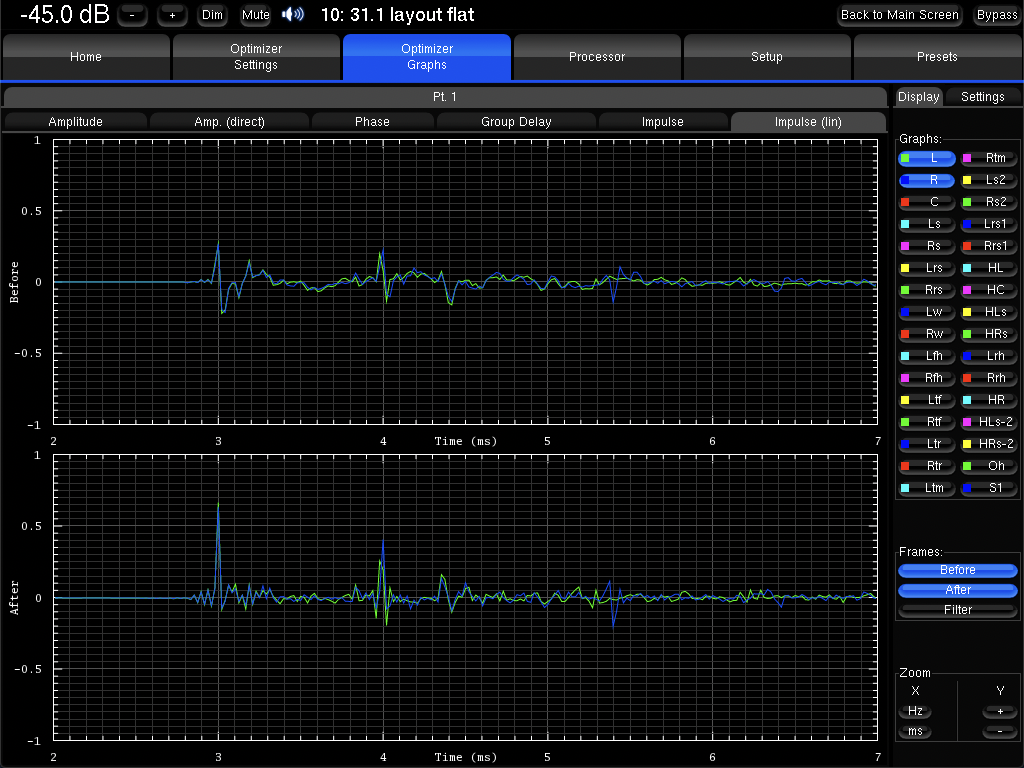
The Optimizer measures the deviation from the input signal (which, by definition, is distortion), and “pre-distorts” the signal going to the speaker in an equal-but-opposite fashion. The result is a much-cleaner spike at the 3ms mark because the speaker was “forced” to behave more accurately by anticipating its distortion and canceling it out. (The smaller spikes at 4ms and after are reflections of the sound, showing up late because they took longer paths to the microphone.)
You would expect the Left and Right speakers to be identical. But in most systems, the surround speakers will be a bit smaller and will probably use somewhat different drivers, crossovers, etc. So they will be a bit different.
Let’s take a look at what displaying all of the main 7 channels together looks like:
You can see that the Before measurement is beginning to get messy. Different speakers are responding differently to the same input signal. It was this realization that led Trinnov’s founders to realize that they must create a tool for Optimizing the performance of real loudspeakers in a real room before they could ever count on them working together seamlessly to re-create a coherent soundfield.
Okay, let’s add in the rest of the main channels, some of which are even smaller than the surrounds and are mounted in the ceiling:
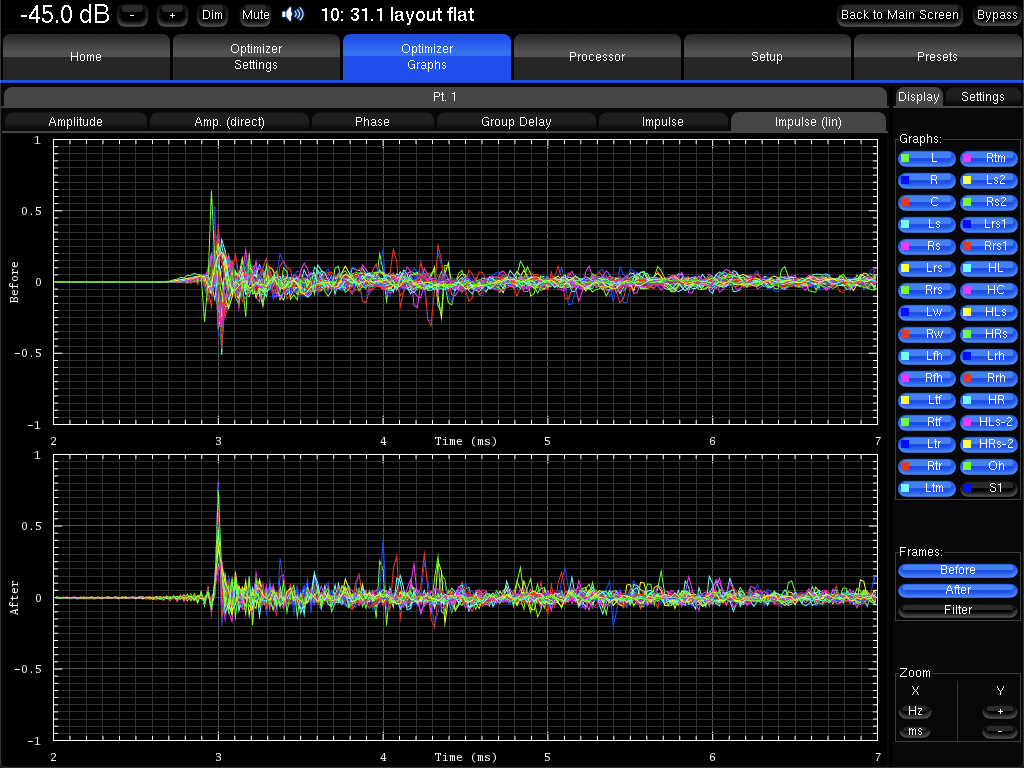
Obviously, there are a LOT more reflections in the room when all 31 main speakers are playing. So the response after the impulse gets “noisier.”
But look at the initial impulse itself. The difference between the Before and After responses is like the difference between a train wreck and a well-oiled machine. In fact, the initial transient is so cleanly reproduced that it is difficult to see any colors below the top one or two (in this case, yellow and green). They are all lined up that accurately.
As it turns out, our ears are incredibly sensitive to these tiny differences in the time domain. There are (no doubt) really solid evolutionary reasons for this to be true. But the difference is not subtle. Turn Acoustic Correction on and off on a well-calibrated system and hear it for yourself.
But, I did not hear a pistol go off during the measurements…
Remember the square wave and all those sine waves? It is merely a specific example of how it is possible to move back and forth between the frequency and time domains. In the Optimizer, we use an “MLS” (Maximum-Length Sequence) test signal that is specifically designed to yield accurate frequency- and time-domain information so that we can move between the two domains, so as to determine what the problem is and how best to solve it.
You may have thought we were using pink noise – but listen more closely and you will hear a signal embedded within the main sound that you hear. It is moving up and down with precision. The test signal is not pink noise. It is our MLS signal and it is the reason why we harvest more information about your system in less time than competing systems can hope to do.
So, what do we do with all this information? That will be a topic for another day.